Reviewing Reviews
A Study of the Helpfulness of Yelp User Reviews
John Bowers, Michaela Kane, Jarele Soyinka, & Nisha Swarup
Introduction & Objectives
Most people are familiar with the popular website Yelp, which connects people with local restaurants and businesses and is ranked #51 in US web-traffic. The lifeblood of the website is its extensive archive of reviews, which empowers users to make informed choices. Whether the user is selecting an entree at a trendy new restaurant or considering facilities for a sophisticated medical procedure, Yelp offers a vast range of crowdsourced insights. After reading others’ reviews of businesses, users can elect to rate those reviews as 'Useful,' 'Funny,' or 'Cool.'

For our project, we decided to investigate how and why users rate reviews as belonging to these three categories. In particular, we wanted to investigate what made a post useful to other users. By determining which characteristics of reviews contribute to their usefulness, we aimed to create a model capable of predicting a review's usefulness given its content. Such a model would help sites like Yelp give its users the best possible experience by highlighting the reviews most likely to be useful for a given business, even if those reviews have not been voted on at all. This could also allow companies like Yelp to better determine the order in which reviews should be shown, rather than blindly prioritizing reviews less likely to be useful to consumer decision making.
Data Collection & Initial Visualizations
To start, we downloaded a large archive of Yelp reviews (about 2 million total) from a Yelp-sponsored data competition page. To make the data easier to work with, we chose to sample only those reviews which were published in 2015 (about 600,000 total). After some simple cleaning to remove duplicates and verify the data’s integrity, we began initial data visualization. Our first histogram of a sample of 50,000 reviews from the data revealed the following:
Frequency of Votes per Post
Number of Posts with 0 Votes:
Clearly, many reviews are not receiving any votes for usefulness, coolness, or funniness, which indicates the following challenges to consider with this dataset:
- Our model must be capable of dealing with large training and test sets due to the massive volume of reviews published on Yelp
- Due to the nature of Yelp’s review rating system, our training data is inherently flawed – reviews might not receive votes because they are:
- actually not useful/funny/cool (this is optimal), or
- despite being useful/funny/cool, the review simply did not receive any exposure and so received zero votes.
With these confounding factors in mind, we moved into the process of model selection.
Models
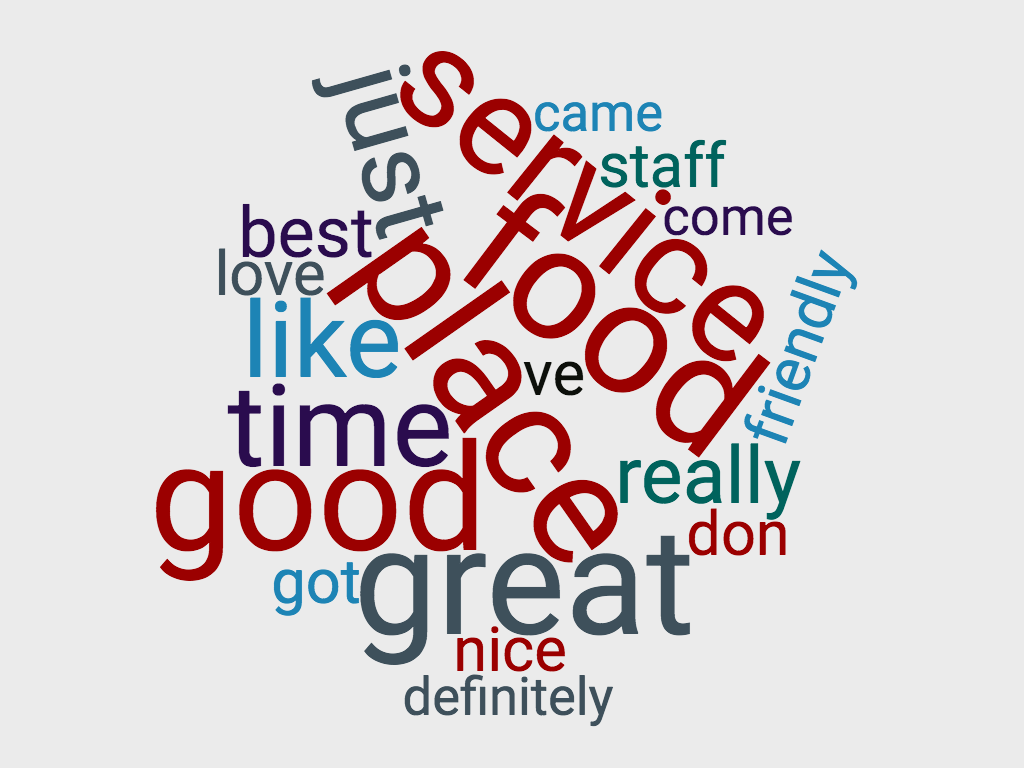
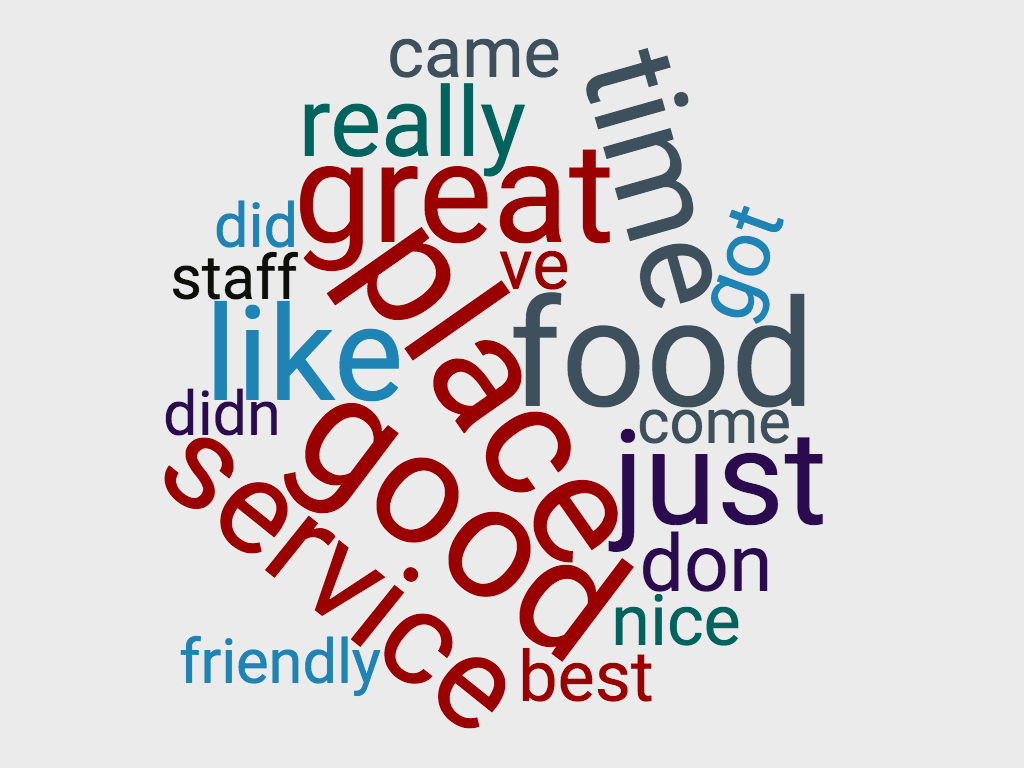
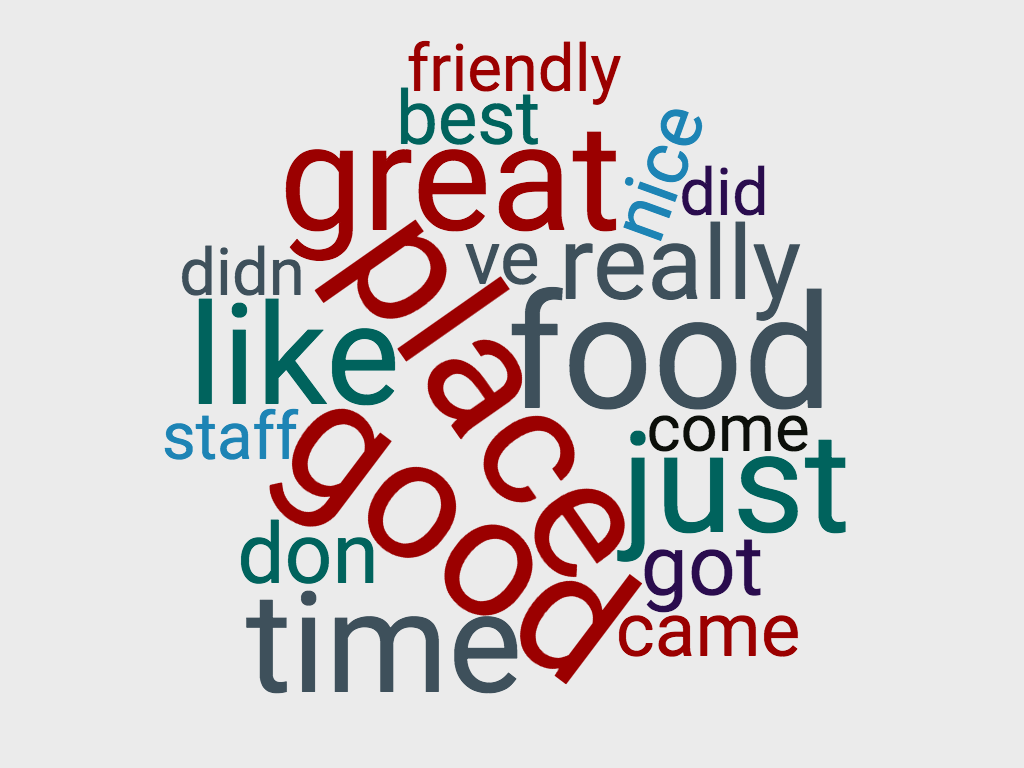
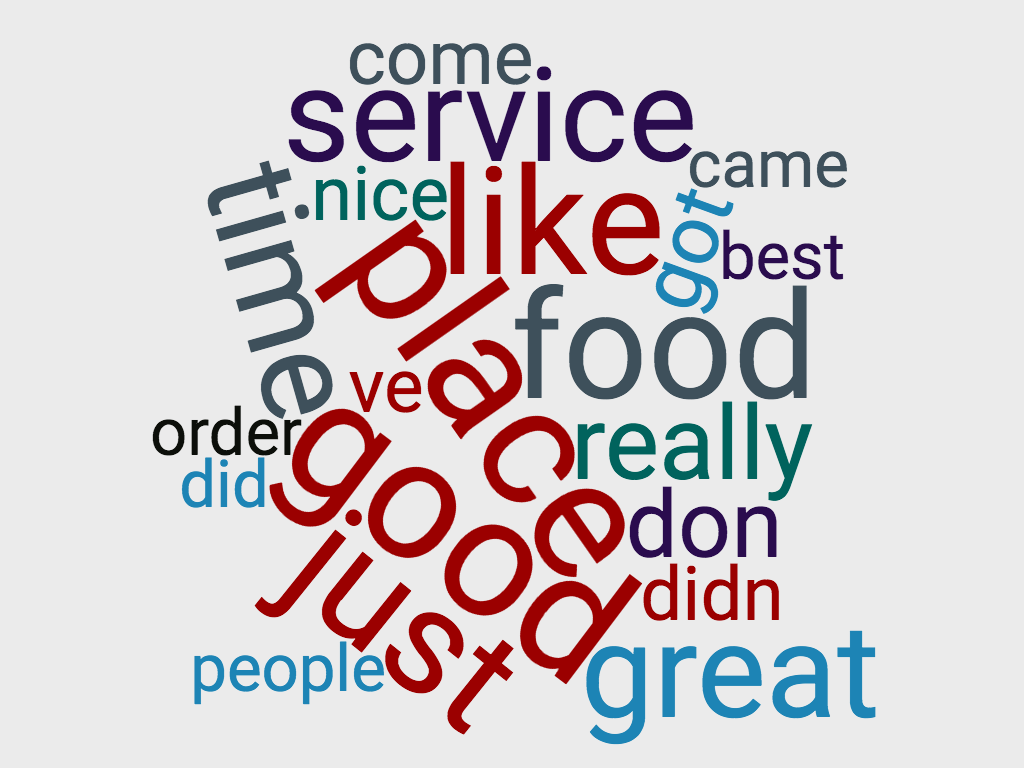
Vote Type Word Clouds
Given that we were working with text data, our first step was to get the reviews into a form interpretable by our model. After experimenting with a number of methods to extract features from text, we settled on non-binary count vectorization with Tf-idf weighting, a word-based tokenizer, and a no stemming algorithm. This configuration seemed to give the best and most stable results overall. We found that using stemming algorithms, word pairs, and other enhancements failed to boost our results. We tried weighting observations according to how many votes of a particular kind they received, but ultimately found that our best results came from simply considering each review's classification in binary terms (ex. Did receive a helpfulness vote vs. Did not receive a helpfulness vote).
After vectorizing the reviews we tried 4 different classification algorithms for sentiment analysis: Random Forests, AdaBoost with Random Forests and Logistic Regression, Linear SVC, and Logistic Regression. Each algorithm was fit and tested on all three different comment types (funny, cool and useful). Class weights were set to “balanced” in each case to compensate for our imbalanced sample: only a minority of reviews received any votes at all. Other weighting techniques produced disadvantageous trade offs as described below. Unfortunately, Random Forests and AdaBoost did not perform particularly well on our dataset despite intensive tuning. Linear SVC and Logistic Regression performed comparably well, so we went on to compare their finer points.
Linear SVC seemed more sensitive to its tuning parameter than Logistic Regression. With minor changes to the parameter, Linear SVC often fluctuated in accuracy for both classes. Furthermore, as the samples tested became larger Linear SVC experienced significantly longer fit times than Logistic Regression. Finally – and perhaps most importantly for our project – Logistic Regression can natively provide class probabilities while making predictions. This would be extremely useful in ranking reviews that have not yet been voted on. While SVC is capable of making probability estimates, it does so through an extremely expensive cross validation procedure. As such, we decided that Logistic Regression provided the best model for our particular objectives.
Table of Useful Model Accuracies on Yelp Data
| Model | False Positive | False Negative | True Positive | True Negative | Positive Accuracy | Negative Accuracy | Cross Validated Accuracy | Cross Validated AUC | Training Set Accuracy |
|---|---|---|---|---|---|---|---|---|---|
| Random Forest | 0.260 | 0.495 | 0.541 | 0.712 | 0.491 | 0.755 | 0.646 | 0.662 | 0.652 |
| Linear SVC | 0.332 | 0.387 | 0.528 | 0.740 | 0.599 | 0.661 | 0.634 | 0.674 | 0.647 |
| Logistic Regression | 0.377 | 0.371 | 0.503 | 0.735 | 0.645 | 0.612 | 0.613 | 0.655 | 0.625 |
The table above shows the various accuracies of our models on the Yelp Dataset. The green cells indicate the best accuracies for each category. It would appear that although Random Forest has some of the best accuracy scores out of the three, it is also the most highly varying, with a positive accuracy rate of less than 50%. Logistic Regression, on the other hand, tends to be very robust across all of the different scoring methods, and it has the highest positive accuracy rate of nearly 65% (compared to Linear SVC's 59.9% and Random Forest's 49.1%).
For the applications of our project, some might argue for prioritizing positive accuracy, since the goal of our model is to accurately predict whether a review is useful such that it can be placed where users can easily see it. However, when we tried to weight our model on positive accuracy, we found that the tradeoff in negative accuracy was unacceptably poor. After all, there is no point in making the useful reviews more visible if it also bumps non-useful reviews. Furthermore, our model is intended to be used probabilistically – even if a review falls under the .50 probability threshold needed to label it as being positive, its positive class probability estimate can nonetheless distinguish it from other reviews labeled as negative.
Useful Logistic Regression Accuracies: Biased in Favor of Positive Accuracy
| Percentage from Balanced | Positive Accuracy | Change in Positive Accuracy | Negative Accuracy | Change in Negative Accuracy |
|---|---|---|---|---|
| 1% | 0.672 | - | 0.529 | - |
| 2% | 0.728 | + 0.056 | 0.432 | - 0.097 |
| 3% | 0.777 | + 0.049 | 0.339 | - 0.093 |
| 4% | 0.822 | + 0.045 | 0.258 | - 0.081 |
| 5% | 0.861 | + 0.039 | 0.188 | - 0.070 |
Although positive accuracy does increase, negative accuracy decreases at nearly twice the rate, making a model biased in favor of positive accuracy unappealing.
When run on the Yelp Dataset, our model tagged the following reviews as highly likely/unlikely to be termed 'useful,' 'cool,' and 'funny' respecively:
Probability of “Useful” Classification: 71.2%
“This place certainly changes your mood, if your having a rough morning that is. I see the place and drive around it and it looks like a normal building. I park in the back and while walking in the first thing I notice is the sitting area outside. The design of the little open gazebo sitting area is so nice... (review continues)”
Probability of “Funny” Classification: 70.0%
“Our first trip to Dumpling King was admittedly a little nerve-wrecking. Besides not having a clue where it was, or really having never heard about it at all, it was strange walking into a place that was pretty much empty of other diners, but full of bright floral designs...and Christmas decorations... (review continues)”
Probability of “Cool” Classification: 64.1%
“This is a new restaurant in the NYNY. It's right off the Brooklyn Bridge and accessible from the Strip or from inside the NYNY. From the inside, there's a bar area, then a set of glass doors, then a large dining area with a larger bar. From the Strip, there's a really nice patio area, including a bar... (review continues)”
Probability of “Useful” Classification: 21.7%
“Food is great service not so great.”
Probability of “Funny” Classification: 22.1%
“The food is great, the staff is friendly and it's a great atmosphere. Definitely recommend”
Probability of “Cool” Classification: 34.0%
“The food was great! Great service too.”
Conclusion
Although we feel that we pushed the limits of our models, the confounding factors in our data capped our cross validated accuracy in the low to mid 60 percent range for both classes. These factors are inherently arbitrary in nature, which was reflected in the tuning for Random Forests and AdaBoost. Despite the weighting and biases we added to our model, the subjectivity of what humans consider to be funny, cool, or useful rendered those efforts useless. Our task was more difficult than simple sentiment analysis, as positivity and negativity are more distinct and easily differentiable categories than helpful and unhelpful.
Yet the relationship between a review’s content and how it is perceived by other users is not completely arbitrary as evidenced by our relative success with LinearSVC and Logistic regression. Consistent keywords and results for reviews demonstrated our models’ strengths through their respective cross-validation procedures. Clear trends are evident within the data, and should be leveraged to the greatest possible extent despite their imperfection.
This is further evidenced as we went beyond the scope of our project to test on Amazon reviews, for which the rating system differs. Users on Amazon can rate reviews as either "helpful" or "not helpful." This dataset enabled us to target reviews that had been provably rated a large number of times, and we secured a large sample pool of helpful (voted helpful over 50%) vs. non-helpful reviews. When tested on this dataset, our models achieved positive and negative accuracies between 72% and 80%. This speaks to the advantages offered by a review rating system that accommodates negative votes: by putting a denominator on helpfulness ratings, they make it far easier to train models to recognize useful and not useful as different classes.
The benefits of a usefulness ranking model like the one we propose are extensive. Websites implementing such a model would be able to score and rank unrated or underexposed reviews, and companies would gain greater insight into what makes a review helpful to consumer decision making. This could have applications in advertising and development, empowering businesses to emphasize features commonly discussed in reviews through product innovation. Even in the presence of confounding factors, a wealth of information such as that offered by Yelp’s review corpus can be leveraged into powerful decision-making tools.
Works Cited
Danescu-Niculescu-Mizil, C., Kossinets, G., Kleinberg, J., & Lee, L. (2009, April). How opinions are received by online communities: a case study on amazon. com helpfulness votes. In Proceedings of the 18th international conference on World wide web (pp. 141-150). ACM.
Das, S. (2015). Beginners Guide to learn about Content Based Recommender Engines. Retrieved from https://www.analyticsvidhya.com/blog/2015/08/beginners-guide-learn-content-based-recommender-systems
Ghose, A., & Ipeirotis, P. G. (2011). Estimating the helpfulness and economic impact of product reviews: Mining text and reviewer characteristics. IEEE Transactions on Knowledge and Data Engineering, 23(10), 1498-1512.
Kaggle (2015). Amazon Fine Food Reviews. Retrieved from https://www.kaggle.com/snap/amazonfinefoodreviews
Kim, S. M., Pantel, P., Chklovski, T., & Pennacchiotti, M. (2006, July). Automatically assessing review helpfulness. In Proceedings of the 2006 Conference on empirical methods in natural language processing (pp. 423-430). Association for Computational Linguistics.
Leskovec, J., Rajaraman, A., & Ullman, J. D. (2014). Mining of massive datasets. Cambridge University Press.
Marafi, S. (2015). Collaborative Filtering with Python. Retrieved from http://www.salemmarafi.com/code/collaborative-filtering-with-python
McAuley, J. and Leskovec, J. (2013). From amateurs to connoisseurs: modeling the evolution of user expertise through online reviews.
Pang, B., & Lee, L. (2008). Opinion mining and sentiment analysis. Foundations and trends in information retrieval, 2(1-2), 1-135.
Yelp (2016). Yelp Dataset Challenge. Retrieved from https://www.yelp.com/dataset_challenge


